How to Choose the Best POY Spinning Line in 2026?
Choosing the best POY Spinning Line in 2026 requires more than comparing machine prices. It demands a practical review of output, polymer quality, energy use, automation, and after-sales support. A line may promise 1,000 kilograms per day, yet unstable cooling can create uneven denier, frequent breaks, and expensive waste. The details matter. No line is perfect.
Georg Stausberg, a recognized leader in man-made fiber machinery, has emphasized, “Sustainability is not a trend, but a necessity.” This view is highly relevant to modern POY production. Buyers should examine energy consumption per kilogram, heat recovery, material efficiency, and compatibility with recycled polymers. They should also inspect the winding unit closely. A smooth package surface, stable tension, and quick doffing can influence downstream texturing performance. These points are easy to overlook during a factory visit.
A reliable decision should combine supplier data with production evidence. Ask for test results using your actual polymer, spinneret design, and target denier. Request references from plants with similar capacity. Check response times for spare parts and technical service. Digital monitoring can help, but it cannot replace skilled operators. This is where my own judgment remains cautious. The newest control system may look impressive, but a simpler line can perform better when maintenance teams lack training. The best POY Spinning Line is therefore not always the fastest or most expensive. It is the line that delivers consistent yarn, manageable operating costs, safe working conditions, and measurable long-term value.
Define POY Specs: PET, 30–300 denier, 2,500–3,500 m/min
How to Choose the Best POY Spinning Line in 2026?
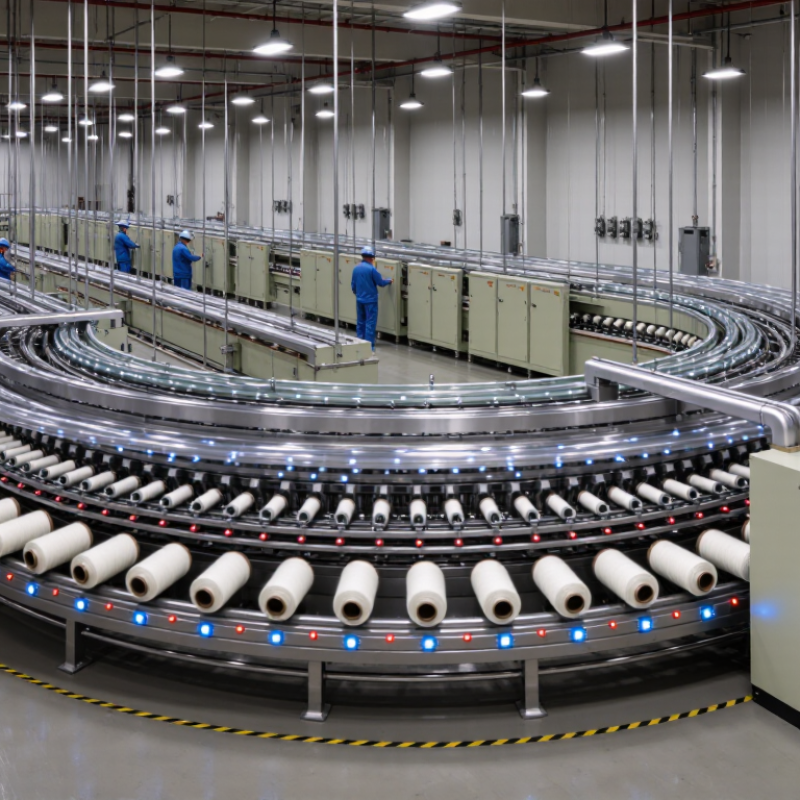
For PET POY production, define the product before comparing equipment. A target range of 30–300 denier requires flexible spinning control, not simply a larger machine. Fine 30-denier yarn needs stable melt flow, precise metering, and gentle quenching. Coarser 300-denier yarn demands stronger throughput and reliable filament cooling.
A practical operating window is 2,500–3,500 m/min. Lower speeds can support process adjustment during trials. Higher speeds may improve output, but they expose weak temperature control and unstable winding tension. Speed is not everything.
Review polymer viscosity, chip moisture, spinneret design, quench-air uniformity, and winding package hardness together. Moisture control deserves special attention because poorly dried PET can create breaks and uneven yarn.
Ask for production records using yarn close to your specifications. Check denier variation, elongation, tenacity, oil pickup, and package formation across several positions. Examine the yarn after conditioning, not only immediately after winding. A clean test sheet can still hide shift-to-shift variation. In practice, operators often discover small tension differences near the machine ends. That detail may seem minor, yet it can affect downstream weaving performance.
Leave room for correction. A line selected only for its maximum speed may disappoint when producing fine denier yarn continuously.

Compare Line Capacity: 100–300 t/day and 24–96 spinning positions
Choosing a POY spinning line in 2026 starts with capacity, not brochure language. Textile Exchange’s Materials Market Report 2024 estimated polyester at about 57% of global fiber production in 2023. Demand is significant. However, larger output is not automatically better.
Compare the working range carefully: 100–300 tonnes per day and 24–96 spinning positions. A 100-tonne line with 24 positions averages 4.17 tonnes per position daily. A 300-tonne line with 96 positions averages 3.13 tonnes.
These figures are only indicative. Polymer type, denier, winding speed, and operating hours can change the result. Position count alone can mislead.
ITMF’s 2024 International Textile Machinery Shipment Statistics shows continued investment in synthetic-fiber and spinning equipment, but investment decisions still require plant-level evidence. Ask for verified output at your target denier, not only maximum capacity. Check energy use per kilogram, automatic doffing time, waste during grade changes, and stable operation above 90% uptime. Small details matter.
I once favored the biggest line. That assumption was weak. A 300-tonne system may create excess inventory if orders fluctuate. A 24-position line may offer better flexibility, but labor and maintenance costs can rise per kilogram. Request trial data, maintenance records, and three operating scenarios before choosing.
Numbers need context.
Evaluate Quality Control: Uster CV%, denier deviation, and 0.3–0.8% oil pickup
How to Choose the Best POY Spinning Line in 2026?
Quality control should be judged from measured yarn, not impressive machine specifications. Start with evenness CV%, which reflects mass variation along the filament. A lower value usually means more consistent yarn, but the acceptable range depends on denier, polymer, and spinning speed. Compare results from the same test method and conditioning time. Otherwise, the numbers may mislead you.
Denier deviation needs equal attention. Check average denier, variation between positions, and changes during a long production run. A practical inspection should include samples after startup, speed changes, and extended operation. Record the position number and production time. Small shifts can reveal a damaged guide, unstable metering, or uneven cooling. The pattern matters.
Oil pickup should normally remain within 0.3–0.8%, according to the yarn’s intended use and finish design. Too little oil may increase friction, static, and filament breaks. Too much can affect winding, package stability, or later dyeing behavior. Test several packages, not just one. A clean result is encouraging, but it is not proof of stable production. Sampling may miss short disturbances. This is where many evaluations become overly confident. Ask for raw records, repeat tests, and process logs before choosing a line.
Assess Energy and Automation: kWh/kg, online monitoring, and auto-doffing
How to Choose the Best POY Spinning Line in 2026?
Energy and automation deserve equal attention when evaluating a POY spinning line. Textile Exchange’s Materials Market Report 2024 states that polyester represented about 57% of global fiber production in 2023. This scale makes small efficiency gains commercially important. However, a supplier’s kWh/kg figure means little without clear boundaries. Ask whether it includes spinning, cooling, compressed air, auxiliary drives, and startup waste.
Use a calibrated power meter and divide total electricity by saleable POY output. Not gross production. A practical trial should record kWh/kg, filament breaks, denier variation, and waste during shift changes.
The International Energy Agency’s Energy Efficiency 2023 report identifies industry as one of the largest energy-consuming sectors worldwide. That supports measurement, but it does not provide a universal POY benchmark. Be careful here.
Online monitoring should show spindle speed, heater temperature, pressure, tension, and power trends in one dashboard. Alarms must be useful, not noisy. Auto-doffing can reduce manual handling, shorten package-change time, and improve operator safety. Yet it may add sensors, drives, and standby consumption. Measure the whole line for a full production week. One impressive test shift can mislead. I would also challenge unusually low figures, because unstable running may hide inside them. Good automation makes problems visible before a full package fails.
Verify ROI and Compliance: uptime, waste rate, payback, and 2026 standards
How to Choose the Best POY Spinning Line in 2026?
A strong POY spinning line should prove its value beyond speed and output. During factory evaluations, I compare recorded uptime with the supplier’s theoretical capacity. A line running at 92% uptime may outperform a faster line operating at 78%. Ask for maintenance logs, not only presentation figures. Check stoppage duration, restart time, and spare-part response.
Waste rate directly affects payback. Measure polymer loss, yarn breaks, off-grade packages, and startup waste per production shift. A small waste difference becomes expensive across thousands of operating hours. Use your own polymer price, labor cost, energy tariff, and production mix in the ROI model. A spreadsheet can look convincing. That assumption is risky. Include training, installation, software updates, utilities, and planned shutdowns.
Payback should reflect real cash flow, not optimistic volume. Test conservative, expected, and peak scenarios over three to five years. For 2026 compliance, request documented evidence covering electrical safety, machine guarding, emissions, workplace exposure, energy monitoring, and waste handling. Requirements vary by location, so involve an independent compliance specialist before signing. Verify material traceability and digital records during a live trial. One missed alarm can reveal more than a polished audit file. Ask operators whether the interface is clear at 2 a.m. Reliability is practical, not decorative.
How to Choose the Best POY Spinning Line in 2026? - Verify ROI and Compliance: uptime, waste rate, payback, and 2026 standards
| Evaluation Dimension | Entry / Flexible Line | Standard High-Output Line | High-Efficiency Line | How to Verify Before Purchase |
|---|---|---|---|---|
| Typical polymer | PET chips for general-purpose POY | PET chips for apparel and textile applications | PET chips with optimized melt-flow and process control | Require polymer compatibility data, IV range, moisture limits, and approved raw-material specifications. |
| Nominal spinning speed | 3,000–4,500 m/min | 4,000–5,500 m/min | 4,500–6,000 m/min | Confirm guaranteed speed at the target denier, polymer IV, quench conditions, and package weight. |
| Practical production capacity | 40–70 metric tonnes/day | 70–110 metric tonnes/day | 90–130 metric tonnes/day | Use demonstrated output from a witnessed acceptance test, not only nameplate capacity. |
| Expected operational uptime | 88–92% | 90–95% | 93–97% | Define uptime as scheduled production time minus planned and unplanned downtime; request 12-month records from comparable installations. |
| First-quality waste rate | 2.0–3.5% | 1.2–2.5% | 0.8–1.8% | Measure start-up waste, broken-filament waste, off-grade packages, and rework separately. |
| Specific electricity consumption | 0.90–1.20 kWh/kg | 0.75–1.00 kWh/kg | 0.60–0.85 kWh/kg | Include spinning, quench air, auxiliary systems, cooling, drives, and compressed air in the meter boundary. |
| Denier flexibility | 30–300 denier | 20–300 denier | 15–300 denier, subject to configuration | Run a product-mix trial covering the smallest, largest, and highest-volume deniers. |
| Package quality consistency | Acceptable for standard products | Suitable for stable commercial production | Best suited to tight tension and dye-uniformity requirements | Set measurable limits for denier CV%, winding tension, package hardness, shrinkage, and dye uniformity. |
| Automation and traceability | Basic PLC, alarms, and operator reports | Recipe management, production monitoring, and electronic batch records | Integrated MES connectivity, real-time OEE, predictive alarms, and energy dashboards | Check data ownership, export formats, user access control, time synchronization, and cybersecurity procedures. |
| Indicative installed investment | USD 4–8 million | USD 7–14 million | USD 12–22 million | Obtain a total-cost-of-ownership quotation covering utilities, installation, commissioning, spare parts, training, and civil works. |
| Indicative simple payback | 3.0–5.0 years | 2.5–4.0 years | 2.5–4.5 years | Recalculate with local selling price, contribution margin, utilization, electricity tariff, labor, financing, taxes, and scrap value. |
| Recommended maintenance strategy | Preventive maintenance and critical spare-parts stock | Preventive maintenance with condition monitoring | Condition-based and predictive maintenance | Require mean time between failures, mean time to repair, response time, spare-part lead time, and service coverage. |
| Core 2026 compliance checks | Risk assessment; machine guarding; emergency stops; electrical safety; lockout/tagout; noise and thermal exposure controls; chemical and polymer handling procedures; electrical documentation; operator training; environmental permits; energy and waste monitoring. | Request a compliance matrix mapped to the installation country and confirm that all declarations, test reports, manuals, and safety circuits are supplied before shipment. | ||
| Relevant management and equipment frameworks | ISO 9001 for quality management; ISO 14001 for environmental management; ISO 45001 for occupational health and safety; ISO 50001 where energy management certification is required; IEC 60204-1 for electrical equipment of machinery; ISO 12100 for machinery risk assessment; ISO 13849-1 or IEC 62061 for safety-related control systems, where applicable. | The applicable legal requirements depend on the country, electrical system, machine scope, and installation date. Obtain written confirmation from a qualified local compliance specialist. | ||
| Acceptance-test recommendation | Run a 72-hour continuous test at agreed production speed, target denier, specified polymer, and normal utility conditions. Record output, uptime, waste, electricity, package quality, alarms, safety functions, and operator interventions. | Link payment milestones and warranty remedies to independently measured performance results. | ||